-

In one of the jobs that I’m currently working, I was asked to run a training/Professional Learning session on Google Sheets. The not-for-profit organisation utilises the software in many different ways primarily for budgeting, but includes various accounting purposes and budget burndown tracking. Without understanding where the users Excel/Google Sheets literacy stood, I developed some…
-

Introduction The last post in this Data Analyst Roadmap series was regarding the use of Data Visualisation tools. Given that I have previously outlined how I have displayed understanding and analysis within statistics, SQL, Python, and data manipulation & visualisation, it is now time to use all of these tools and techniques in projects. This…
-
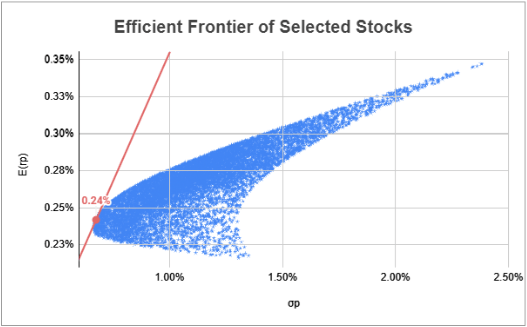
In a previous post, I outlined how someone might be able to track their stock portfolio. Speaking of, have you copied this version? Have you made your own? I would love to see what you’ve done – link it in the comments below! How does one get to the point of tracking their stocks though?…
-

If I asked you what the price of a pencil is today, what would you say? What if I asked you what the price of a pencil is today knowing that it was $1.05 yesterday – what is the price of the pencil today? What about if it was $1.05 two days ago and $1.05…
-

In the ongoing Data Analyst Roadmap series, we’ve navigated through pivotal terrains like statistics, SQL, Python for data analysis, data manipulation, and statistical analysis. Now, entering the sixth phase, we’re delving into the area of data visualisation tools. Within the data analyst’s toolkit, the art of conveying insights is just as critical as the analytical…
-

In a previous post, I outlined how you can use the ‘Solver’ add-in to optimise decision on profit based on a single-item revenue and cost structure, and the optimal mix of inputs for six products to maximise profit. Whilst hearing about one of my bosses discussing allocating people into groups recently, I was reminded about…
-
Homework Review How did you go with those 3 exercises from 2 weeks ago? Here is the link to the blog solutions: https://docs.google.com/spreadsheets/d/12HzdwkqLbfFiwKOtYpnBTnOVRZdp3aDruJAwEhso8eE/edit#gid=222398939 Google Sheets Charts Diving into the world of making charts in Google Sheets allows me to transform all of those numbers and words into something that can be easily understood and a…
-

Statistical analysis stands as a cornerstone in the journey of data analysis, serving as a pivotal force in extracting meaningful insights and aiding informed decision-making. Positioned as the quantitative backbone, it empowers analysts and data scientists to derive reliable predictions and conclusions. This type of analysis furnishes the necessary tools for describing and summarising data.…
-

How often do people respond to your emails? How often do they open it? How often do they delete your emails before even opening it? Something that a marketing analyst aims to do is optimise their email campaigns. Something that would be beneficial for them is knowing the probability of a customer actually engaging with…
-

There are a few approaches that I take to making these posts. Some data I will use from an online source (and reference), whereas others I will generate using equations. Since privately tutoring some local young people, I have had the pleasure (actually not sarcasm) of revisiting geometry. This meant that I had to relearn…

James Miller CV
Data Analyst | Process Improvement | Skilled in Statistical Analysis, Data Visualisation, and Instructional Delivery | Excel, Google Sheets, SQL, Python, Power BI
Blog


Leave a comment