
Premise
Back in September of this year, I posted a blog about how to use INDIRECT to count across multiple spreadsheets using Excel. When I was creating this post, I actually developed 3 different approaches to it. This was due to the limited functionality that Google Sheets presents regarding INDIRECT, arrays, and maintaining COUNTIF across those sheets. My stubbornness wouldn’t allow me to let this lack of functionality pass me by without bringing this post into the world. Here we are!
I have taken a similar approach as that September post, but used a different framework (again) to count values across these sheets, but also to take it a step further. I’ve used the perspective of a mini-golf, or putt-putt (whatever you want to call it), business to see the types of decisions and understandings that can be taken from the player information of the holes that they play.
Keep in mind that although I walk through all of the steps, with the intention that you are copying along the way, you can definitely jump to the end and copy the document and adjust as you see fit.
Mock Sample
If you have read that previous post, you will be in good stead. If not, what is essentially going to be created is a master scorecard and individualised scorecards that, presumably, the putt-putt customers would have been using and filling out honestly.
https://docs.google.com/spreadsheets/d/11qCBa5Q4H7JODEst7gdexeQ7f89BO8ufN2CZCUyG97U/edit?gid=0#gid=0
Master Scorecard
This master scorecard provides us with a way to track the 3 courses (that the business has created) in one summary sheet. To start off with, I’ll but some basic company information, then a place for the Course name and Hole number:

I’ll then create sections for each available Course:

Now to add the number of holes for each course (18). I’ll be using the SEQUENCE function for this:
=SEQUENCE(1,18)

I’ll be resizing is mainly for aesthetics, but also so I can see all of the values across all of the courses:

I’ll also extend the merge of Title and Subtitle across to the S column:

Scorecard Template
Now, we can move to the individual scorecards, where players will be entering their scores and we will be pulling the data from. First, I’ll create a new sheet then remove bulk of the rows (9 to 1000):

Now to enter any necessary information (Date, Course, Hole, and number of Players):

I’m going to use my old friend SEQUENCE (again) to print out the number of holes (18):
=SEQUENCE(1,18)

Then to resize the columns:

Some formatting never goes astray:

Let’s put some random numbers in to make sure we can get the connections going. I’m going to use the RANDBETWEEN function (values 1 to 6) and copy-paste the function across the array:
=RANDBETWEEN(1,6)

Then I’ll copy-paste the values so that I don’t need to worry about them updating on every edit:

Summary statistics
Now that we have the first Scorecard (template) created, I can go back to the Summary sheet and get myself sorted with the various statistics that I’m interested in tracking, like the minimum and maximum number of strokes for each hole, the average number of strokes for each hole, and their variance & standard deviation. It could also be interesting to track the number of minimum and maximum strokes for each hole.

Minimum
This is where the functionality of INDIRECT, ARRAYFORMULA, and additional functions (MIN, MINIFS, COUNTIFS, etc) aren’t able to function in Google Sheets. My intention is to find the minimum score for the first hole on this course across all players who have played it. I am going to outline how it should be processed within Google Sheets, but the outcome of this is ultimately unsuccessful due to the inability to read across multiple sheets and report back from more than the top layer.
Unsuccessful Outcome
Using the MIN function, I’ll find the minimum stroke value for each of the players in the scorecard. Using the referencing B$4:B, I’ll search for all players in the party, starting from the cell B4 (Player 1) but allowing me to move/copy across the columns. This allows me to automatically account for each hole:
=MIN(Scorecard1!B$4:B)

For the first hole on this course, we can see that the minimum number (on this scorecard) is 3:

Let’s copy it across (to 18), making sure that everything’s working as we intended — looks good:

Before we get into any more statistics, I want to do a few things so that we can get into the main part of this blog post:
- Create a template scorecard, and
- Generate some more scorecards.
Create a template
To create the template, I will Duplicate the Scorecard1 sheet, name it Template, and remove all of the values:


Generate some new scorecards
I’ll create two more so that we can get some more data to play with. I’ll duplicate the Template sheet, rename it to ‘Scorecard2’, then use the RANDBETWEEN function for those values:

INDIRECT Referencing
This is the juicy part now. After creating these scorecards, let’s navigate back to the Summary Sheet. I’m going to create a space to track the number of Scorecards created in the document (“workbook”):

The reason I want to do this is due to the automation ahead of us. Reviewing the MIN function from before, we saw that we used the inter-sheet reference technique that has been covered in a previous post; =MIN(Scorecard1!B$4:B). So, let’s write the sheet name ‘Scorecard1’ under the Scorecards heading in column U. This now matches the sheet name at the bottom of the screen:

Let’s use the INDIRECT function to now reference this scorecard title in the column U:
=MIN(INDIRECT(“‘”&U$2&“‘!B$4:B”))

We can see that we still have the same number in B6 (3):

Let’s copy this formula across to column S:

Can you see what we need to account for in the screenshot above? The cell referencing text, B$4:B, isn’t adjusting with the copying process as cell referencing does because it is text. To get around this, we can use a combination of the COLUMN and VLOOKUP functions.
COLUMN will return the column number (not letter) of any cell that you reference. Let’s say I want to see what column number cell B6 is. Since A is column 1 and B is column 2, if I enter COLUMN(B6) into Sheets, it will return a 2:

Let’s copy this across to S and see if we get 19:

Since we know that we are going to get number values, we can use the VLOOKUP function to assist with the solution. So, let’s create a Lookup sheet and enter 1-19 in Column A:

Now enter A to S in Column B:

We can use a VLOOKUP function to translate the COLUMN function into a letter. I like to space my formulas out a bit so that it makes a bit more sense to me. Inside of the MIN function, we have the INDIRECT function. We already know that we’re using this to search within the Scorecard1 sheet and referencing particular cells. This is where the VLOOKUP and COLUMN functions are here to help us with automation. We are using the COLUMN function to tell us the number column we’re on. We use that number output to lookup the corresponding number in the LOOKUP sheet by using the VLOOKUP function. This is transforming the number into a letter. We use this letter within the INDIRECT function to locate the appropriate column in the Scorecard1 sheet:
=MIN(INDIRECT(“‘”&U$2&“‘!”&VLOOKUP(COLUMN(B6),Lookup!$A$1:$B$19,2,0)&“$4:”&VLOOKUP(COLUMN(B6),Lookup!$A$1:$B$19,2,0)))

Copying this formula across to S, we can see this is now working as intended:

Adding Scorecards to the List
Since we’ve got this working for the one scorecard, let’s move onto the next one, Scorecard2. We’ve already created the sheet, so let’s add that name to the list in column U:

Instead of manually adding each scorecard to the formula we’ve created in B6, I’m going to update the formula such that it will account for new scorecards that are added to this list:
=MIN(ARRAYFORMULA(INDIRECT(“‘”&U$2:$U&“‘!”&VLOOKUP(COLUMN(B6),Lookup!$A$1:$B$19,2,0)&“$4:”&VLOOKUP(COLUMN(B6),Lookup!$A$1:$B$19,2,0))))

To test this is working, let’s go into sheet Scorecard1 and change the value B4 to 1:

Yet, when we add lower scores to subsequent sheets, the INDIRECT referencing does not accurately pick them up. Instead, we need to address this by using Google’s Apps Script.
Successful Outcome
To calculate the Minimum values across all shows, we need to run the following code:
function minStrokes() {
const ss = SpreadsheetApp.getActiveSpreadsheet();
const summarySheet = ss.getSheetByName(‘Summary’);
const courseName = summarySheet.getRange(‘B4’).getValue();
const scorecardSheets = ss.getSheets().filter(sheet => sheet.getName().startsWith(‘Scorecard’));
const holeCount = summarySheet.getRange(‘B5:S5’).getValues()[0].length;
let minStrokes = Array(holeCount).fill(Infinity);
scorecardSheets.forEach(sheet => {
const sheetCourseName = sheet.getRange(‘B2’).getValue();
if (sheetCourseName === courseName) {
const lastRow = sheet.getLastRow();
const strokesRange = sheet.getRange(4, 2, lastRow – 3, holeCount); // Get all rows starting from B4 to last row
const strokes = strokesRange.getValues();
strokes.forEach(row => {
row.forEach((stroke, index) => {
if (stroke < minStrokes[index]) {
minStrokes[index] = stroke;
}
});
});
}
});
// Update Summary sheet with the calculated minimum strokes
summarySheet.getRange(‘B6:S6’).setValues([minStrokes]);
}
Maximum
function maxStrokes() {
const ss = SpreadsheetApp.getActiveSpreadsheet();
const summarySheet = ss.getSheetByName(‘Summary’);
const courseName = summarySheet.getRange(‘B4’).getValue();
const scorecardSheets = ss.getSheets().filter(sheet => sheet.getName().startsWith(‘Scorecard’));
const holeCount = summarySheet.getRange(‘B5:S5’).getValues()[0].length;
let maxStrokes = Array(holeCount).fill(-Infinity);
scorecardSheets.forEach(sheet => {
const sheetCourseName = sheet.getRange(‘B2’).getValue();
if (sheetCourseName === courseName) {
const lastRow = sheet.getLastRow();
const strokesRange = sheet.getRange(4, 2, lastRow – 3, holeCount);
const strokes = strokesRange.getValues();
strokes.forEach(row => {
row.forEach((stroke, index) => {
if (stroke > maxStrokes[index]) {
maxStrokes[index] = stroke;
}
});
});
}
});
summarySheet.getRange(‘B7:S7’).setValues([maxStrokes]);
}
Create a Trigger
So we can see the changes made in real time, adding a trigger will allow us to see any change, especially whenever any edit is made:

We can use this same process for all of the following factors:
Average
function avgStrokes() {
const ss = SpreadsheetApp.getActiveSpreadsheet();
const summarySheet = ss.getSheetByName(‘Summary’);
const courseName = summarySheet.getRange(‘B4’).getValue();
const scorecardSheets = ss.getSheets().filter(sheet => sheet.getName().startsWith(‘Scorecard’));
const holeCount = summarySheet.getRange(‘B5:S5’).getValues()[0].length;
let sumStrokes = Array(holeCount).fill(0);
let countStrokes = Array(holeCount).fill(0);
scorecardSheets.forEach(sheet => {
const sheetCourseName = sheet.getRange(‘B2’).getValue();
if (sheetCourseName === courseName) {
const lastRow = sheet.getLastRow();
const strokesRange = sheet.getRange(4, 2, lastRow – 3, holeCount);
const strokes = strokesRange.getValues();
strokes.forEach(row => {
row.forEach((stroke, index) => {
sumStrokes[index] += stroke;
countStrokes[index] += 1;
});
});
}
});
const avgStrokes = sumStrokes.map((sum, index) => sum / countStrokes[index]);
summarySheet.getRange(‘B8:S8’).setValues([avgStrokes]);
}
Variance
function varStrokes() {
const ss = SpreadsheetApp.getActiveSpreadsheet();
const summarySheet = ss.getSheetByName(‘Summary’);
const courseName = summarySheet.getRange(‘B4’).getValue();
const scorecardSheets = ss.getSheets().filter(sheet => sheet.getName().startsWith(‘Scorecard’));
const holeCount = summarySheet.getRange(‘B5:S5’).getValues()[0].length;
let sumStrokes = Array(holeCount).fill(0);
let countStrokes = Array(holeCount).fill(0);
let varianceStrokes = Array(holeCount).fill(0);
scorecardSheets.forEach(sheet => {
const sheetCourseName = sheet.getRange(‘B2’).getValue();
if (sheetCourseName === courseName) {
const lastRow = sheet.getLastRow();
const strokesRange = sheet.getRange(4, 2, lastRow – 3, holeCount);
const strokes = strokesRange.getValues();
strokes.forEach(row => {
row.forEach((stroke, index) => {
sumStrokes[index] += stroke;
countStrokes[index] += 1;
});
});
}
});
const avgStrokes = sumStrokes.map((sum, index) => sum / countStrokes[index]);
scorecardSheets.forEach(sheet => {
const sheetCourseName = sheet.getRange(‘B2’).getValue();
if (sheetCourseName === courseName) {
const lastRow = sheet.getLastRow();
const strokesRange = sheet.getRange(4, 2, lastRow – 3, holeCount);
const strokes = strokesRange.getValues();
strokes.forEach(row => {
row.forEach((stroke, index) => {
varianceStrokes[index] += Math.pow(stroke – avgStrokes[index], 2);
});
});
}
});
varianceStrokes = varianceStrokes.map((variance, index) => variance / countStrokes[index]);
summarySheet.getRange(‘B9:S9’).setValues([varianceStrokes]);
}
Standard Deviation
function stddevStrokes() {
const ss = SpreadsheetApp.getActiveSpreadsheet();
const summarySheet = ss.getSheetByName(‘Summary’);
const courseName = summarySheet.getRange(‘B4’).getValue();
const scorecardSheets = ss.getSheets().filter(sheet => sheet.getName().startsWith(‘Scorecard’));
const holeCount = summarySheet.getRange(‘B5:S5’).getValues()[0].length;
let sumStrokes = Array(holeCount).fill(0);
let countStrokes = Array(holeCount).fill(0);
let varianceStrokes = Array(holeCount).fill(0);
scorecardSheets.forEach(sheet => {
const sheetCourseName = sheet.getRange(‘B2’).getValue();
if (sheetCourseName === courseName) {
const lastRow = sheet.getLastRow();
const strokesRange = sheet.getRange(4, 2, lastRow – 3, holeCount);
const strokes = strokesRange.getValues();
strokes.forEach(row => {
row.forEach((stroke, index) => {
sumStrokes[index] += stroke;
countStrokes[index] += 1;
});
});
}
});
const avgStrokes = sumStrokes.map((sum, index) => sum / countStrokes[index]);
scorecardSheets.forEach(sheet => {
const sheetCourseName = sheet.getRange(‘B2’).getValue();
if (sheetCourseName === courseName) {
const lastRow = sheet.getLastRow();
const strokesRange = sheet.getRange(4, 2, lastRow – 3, holeCount);
const strokes = strokesRange.getValues();
strokes.forEach(row => {
row.forEach((stroke, index) => {
varianceStrokes[index] += Math.pow(stroke – avgStrokes[index], 2);
});
});
}
});
const stdDevStrokes = varianceStrokes.map((variance, index) => Math.sqrt(variance / countStrokes[index]));
summarySheet.getRange(‘B10:S10’).setValues([stdDevStrokes]);
}
Number of Minimum Strokes
function minStrokeCount() {
const ss = SpreadsheetApp.getActiveSpreadsheet();
const summarySheet = ss.getSheetByName(‘Summary’);
const courseName = summarySheet.getRange(‘B4’).getValue();
const scorecardSheets = ss.getSheets().filter(sheet => sheet.getName().startsWith(‘Scorecard’));
const holeCount = summarySheet.getRange(‘B5:S5’).getValues()[0].length;
let minStrokes = Array(holeCount).fill(Infinity);
let minStrokeCount = Array(holeCount).fill(0);
// Calculate the min strokes
scorecardSheets.forEach(sheet => {
const sheetCourseName = sheet.getRange(‘B2’).getValue();
if (sheetCourseName === courseName) {
const lastRow = sheet.getLastRow();
const strokesRange = sheet.getRange(4, 2, lastRow – 3, holeCount);
const strokes = strokesRange.getValues();
strokes.forEach(row => {
row.forEach((stroke, index) => {
if (stroke < minStrokes[index]) {
minStrokes[index] = stroke;
}
});
});
}
});
// Count occurrences of the min strokes
scorecardSheets.forEach(sheet => {
const sheetCourseName = sheet.getRange(‘B2’).getValue();
if (sheetCourseName === courseName) {
const lastRow = sheet.getLastRow();
const strokesRange = sheet.getRange(4, 2, lastRow – 3, holeCount);
const strokes = strokesRange.getValues();
strokes.forEach(row => {
row.forEach((stroke, index) => {
if (stroke === minStrokes[index]) {
minStrokeCount[index]++;
}
});
});
}
});
summarySheet.getRange(‘B11:S11’).setValues([minStrokeCount]);
}
Number of Maximum Strokes
function maxStrokeCount() {
const ss = SpreadsheetApp.getActiveSpreadsheet();
const summarySheet = ss.getSheetByName(‘Summary’);
const courseName = summarySheet.getRange(‘B4’).getValue();
const scorecardSheets = ss.getSheets().filter(sheet => sheet.getName().startsWith(‘Scorecard’));
const holeCount = summarySheet.getRange(‘B5:S5’).getValues()[0].length;
let maxStrokes = Array(holeCount).fill(-Infinity);
let maxStrokeCount = Array(holeCount).fill(0);
// Calculate the max strokes
scorecardSheets.forEach(sheet => {
const sheetCourseName = sheet.getRange(‘B2’).getValue();
if (sheetCourseName === courseName) {
const lastRow = sheet.getLastRow();
const strokesRange = sheet.getRange(4, 2, lastRow – 3, holeCount);
const strokes = strokesRange.getValues();
strokes.forEach(row => {
row.forEach((stroke, index) => {
if (stroke > maxStrokes[index]) {
maxStrokes[index] = stroke;
}
});
});
}
});
// Count occurrences of the max strokes
scorecardSheets.forEach(sheet => {
const sheetCourseName = sheet.getRange(‘B2’).getValue();
if (sheetCourseName === courseName) {
const lastRow = sheet.getLastRow();
const strokesRange = sheet.getRange(4, 2, lastRow – 3, holeCount);
const strokes = strokesRange.getValues();
strokes.forEach(row => {
row.forEach((stroke, index) => {
if (stroke === maxStrokes[index]) {
maxStrokeCount[index]++;
}
});
});
}
});
summarySheet.getRange(‘B12:S12’).setValues([maxStrokeCount]);
}
Account for the Other Courses
Since we have these functions already set up for the Fun Run course, we can create one last script to apply changes for the other courses that exist at this business’ location:
function updateCourseStatistics() {
const ss = SpreadsheetApp.getActiveSpreadsheet();
const summarySheet = ss.getSheetByName(‘Summary’);
const courses = [
{name: ‘Fun Run’, startRow: 4},
{name: ‘Waterways’, startRow: 15},
{name: ‘Jungle Safari’, startRow: 26}
];
courses.forEach(course => {
const courseName = summarySheet.getRange(`B${course.startRow}`).getValue();
const scorecardSheets = ss.getSheets().filter(sheet => sheet.getName().startsWith(‘Scorecard’));
const holeCount = summarySheet.getRange(`B${course.startRow+1}:S${course.startRow+1}`).getValues()[0].length;
let minStrokes = Array(holeCount).fill(Infinity);
let maxStrokes = Array(holeCount).fill(-Infinity);
let sumStrokes = Array(holeCount).fill(0);
let countStrokes = Array(holeCount).fill(0);
let varianceStrokes = Array(holeCount).fill(0);
let minStrokeCount = Array(holeCount).fill(0);
let maxStrokeCount = Array(holeCount).fill(0);
// Gather data across all scorecards
scorecardSheets.forEach(sheet => {
const sheetCourseName = sheet.getRange(‘B2’).getValue();
if (sheetCourseName === courseName) {
const lastRow = sheet.getLastRow();
const strokesRange = sheet.getRange(4, 2, lastRow – 3, holeCount);
const strokes = strokesRange.getValues();
strokes.forEach(row => {
row.forEach((stroke, index) => {
if (stroke < minStrokes[index]) minStrokes[index] = stroke;
if (stroke > maxStrokes[index]) maxStrokes[index] = stroke;
sumStrokes[index] += stroke;
countStrokes[index] += 1;
});
});
}
});
const avgStrokes = sumStrokes.map((sum, index) => sum / countStrokes[index]);
// Calculate variance and counts
scorecardSheets.forEach(sheet => {
const sheetCourseName = sheet.getRange(‘B2’).getValue();
if (sheetCourseName === courseName) {
const lastRow = sheet.getLastRow();
const strokesRange = sheet.getRange(4, 2, lastRow – 3, holeCount);
const strokes = strokesRange.getValues();
strokes.forEach(row => {
row.forEach((stroke, index) => {
varianceStrokes[index] += Math.pow(stroke – avgStrokes[index], 2);
if (stroke === minStrokes[index]) minStrokeCount[index]++;
if (stroke === maxStrokes[index]) maxStrokeCount[index]++;
});
});
}
});
const stdDevStrokes = varianceStrokes.map((variance, index) => Math.sqrt(variance / countStrokes[index]));
// Update the Summary sheet for this course
summarySheet.getRange(`B${course.startRow+2}:S${course.startRow+2}`).setValues([minStrokes]);
summarySheet.getRange(`B${course.startRow+3}:S${course.startRow+3}`).setValues([maxStrokes]);
summarySheet.getRange(`B${course.startRow+4}:S${course.startRow+4}`).setValues([avgStrokes]);
summarySheet.getRange(`B${course.startRow+5}:S${course.startRow+5}`).setValues([varianceStrokes]);
summarySheet.getRange(`B${course.startRow+6}:S${course.startRow+6}`).setValues([stdDevStrokes]);
summarySheet.getRange(`B${course.startRow+7}:S${course.startRow+7}`).setValues([minStrokeCount]);
summarySheet.getRange(`B${course.startRow+8}:S${course.startRow+8}`).setValues([maxStrokeCount]);
});
}
Formatting
Now to make things look a little nicer (and update the tagline of the because I thought of something better):

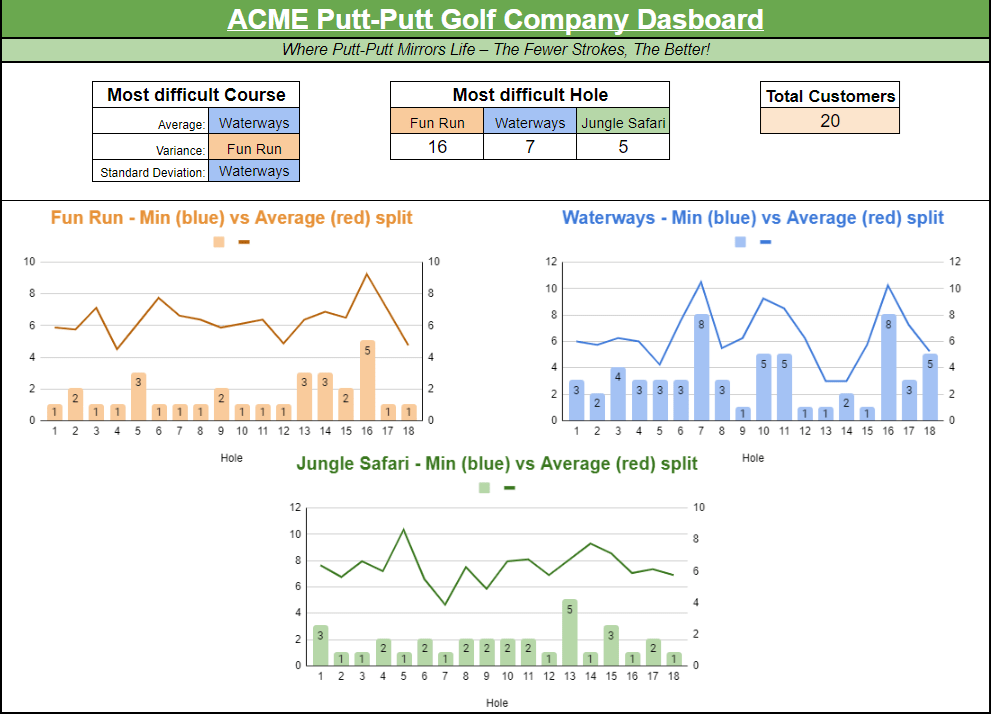
Dashboard

Business Applications
- Develop a strategic to target people for specific holes:
We can find the holes where people (who have played) struggle the most and target offers for customers. Using the MAX function, we can find the hole for each course with the largest minimum stroke value. For ‘Fun Run’, the highest minimum value is hole 16, with the lowest stroke ever recorded as 5. ‘Waterways’ highest minimum value is 8. ‘Jungle Safari’’s highest minimum value is hole 13 (5 strokes). A potential strategy is offering free games for players who score a certain number of strokes lower on these holes. Additionally, provide a free game on the perceived hardest hole at various times of the year.
- Integrate seasonal data
Integrating a date function into this analysis will allow for seasonal data. We can assume that this sport will be more popular during the summer months, hence wanting to develop sales strategies for both summer and winter months, e.g. food/drink and course discount sales.
- Develop a competition circuit for amateur players.
Using the information from the tables above, we can drive traffic into the business by hosting competitions for players and rewards for stroke counts on particular courses and holes.
- Change the course layouts
Use the performance data to make informed decisions about modifying hole difficulty. If certain holes consistently have high variance (e.g., Hole 2), you could adjust obstacles or redesign the hole to balance the challenge, creating a more enjoyable experience that encourages repeat visits. This could be additionally driven by qualitative data through user feedback.
- Develop an app for users to maintain their progress
Develop an app where users can maintain their strokes per hole and progress over time. This comes with the obvious added strategy of building in incentives over time, e.g. sales, promotions, rewards, etc.
- Future R&D idea — develop electronic balls and clubs.
Develop electronic equipment that register hits by golf clubs, counting the number of strokes for each player on each hole. This would have the long-term goal of automating the user experience (potentially leading to staffless venues) and attain data accuracy, completeness, consistency, and validity. There’s also the potential for long-term tips where the app can provide tips or suggestions for improvement on each hole.
Conclusion
Well, it doesn’t take me much to stray far away from my original intent. However, I believe that this comes with benefits, especially when it comes to potential business use cases. Do you have a mini-golf/putt-putt business and stumbled across this blog? Did you consider this use case before without even owning this business and stumbled across this blog? Did you randomly stumble across this blog and decide to use this for something else? Feel free to leave a comment below and let me know what you’ve done with it.
