
In a previous post, I outlined how someone might be able to track their stock portfolio. Speaking of, have you copied this version? Have you made your own? I would love to see what you’ve done – link it in the comments below! How does one get to the point of tracking their stocks though? How do you know which stocks to choose? Investing in stocks can be rewarding but also carries inherent risks, but these are some key considerations to bear in mind prior to investing in stock:
- Risk Tolerance: Understand your risk tolerance, which refers to your ability and willingness to endure fluctuations in the value of your investments. Your risk tolerance should align with your financial goals, time horizon, and emotional capacity to withstand market volatility.
- Financial Goals: Clarify your financial objectives, whether they are short-term (e.g., saving for a vacation), medium-term (e.g., buying a house), or long-term (e.g., retirement planning). Your investment strategy should reflect these goals and the timeframe in which you aim to achieve them.
- Diversification: Diversification involves spreading your investments across different asset classes (such as stocks, bonds, real estate) and within each asset class (across industries, sectors, geographies). Diversification can help reduce overall portfolio risk by mitigating the impact of adverse events affecting any single investment.
- Company Fundamentals: When selecting individual stocks, consider the fundamental factors of the companies you’re interested in, such as their financial health, profitability, competitive positioning, growth prospects, management quality, and corporate governance practices. Conduct thorough research or seek advice from financial professionals before making investment decisions.
- Valuation: Assess whether a stock is undervalued, overvalued, or fairly valued based on fundamental analysis (e.g., price-to-earnings ratio, price-to-book ratio, dividend yield) and qualitative factors (e.g., growth potential, industry trends). Buying undervalued stocks can offer potential for capital appreciation, while overvalued stocks may pose higher risks.
- Market Conditions: Consider the prevailing market conditions, economic indicators, geopolitical factors, and global trends that may impact stock prices and market sentiment. Stay informed about macroeconomic events, interest rates, inflation, and geopolitical tensions, as these can influence market dynamics and investment returns.
- Investment Horizon: Determine your investment horizon, which refers to the length of time you intend to hold your investments before selling them. Longer investment horizons generally allow for a more aggressive investment strategy and may provide opportunities to ride out market fluctuations and benefit from compounding returns.
- Liquidity: Ensure that the stocks you invest in are liquid, meaning they can be easily bought or sold without significantly affecting their market price. Highly liquid stocks typically have narrow bid-ask spreads and high trading volumes, providing liquidity for investors to enter and exit positions as needed.
- Costs and Fees: Be mindful of transaction costs, brokerage fees, taxes, and other expenses associated with buying, holding, and selling stocks. Minimising these costs can enhance your investment returns over time, so compare fees across different investment platforms and consider low-cost investment options.
- Monitoring and Review: Regularly monitor your portfolio performance, track company developments, and stay abreast of market trends and news. Periodically review your investment strategy to ensure it remains aligned with your financial goals, risk tolerance, and changing market conditions. Consider rebalancing your portfolio as needed to maintain diversification and optimise risk-adjusted returns.
By considering these factors and adopting a disciplined approach to investing, you can make informed decisions and build a well-rounded stock portfolio that aligns with your financial objectives and risk preferences. Additionally, seeking guidance from financial advisors or investment professionals can provide valuable insights and help you navigate the complexities of the stock market.
The Final Efficient Frontier – What is it?
The efficient frontier comprises the ideal assortment of portfolios that provide either the maximum expected return for a specified level of risk or the minimum risk for a given expected return. Portfolios situated beneath the efficient frontier are considered suboptimal as they fail to deliver sufficient returns relative to the risk involved. Conversely, portfolios positioned to the right of the efficient frontier are also suboptimal due to their heightened risk levels in relation to the designated rate of return.
How can we use it?
One primary utility of the Efficient Frontier lies in its ability to guide portfolio optimisation. Investors can leverage this framework to construct portfolios that align with their risk preferences and return objectives. By identifying portfolios along the Efficient Frontier, investors can ascertain the optimal allocation of assets to achieve desired returns while minimising risk exposure. Moreover, the Efficient Frontier facilitates effective risk management strategies by elucidating the trade-offs between risk and return. It enables investors to make informed decisions regarding the level of risk they are willing to undertake in pursuit of higher returns or the desired level of return for a given risk tolerance.
Furthermore, the Efficient Frontier underscores the importance of diversification in portfolio construction. By visualising the optimal portfolios along the frontier, investors can appreciate the benefits of spreading their investments across different asset classes, industries, and regions. This diversification strategy helps mitigate risk and enhance portfolio resilience against adverse market conditions. Additionally, the Efficient Frontier serves as a benchmark for performance evaluation. Investors can compare the actual performance of their portfolios against the optimal portfolios delineated by the frontier, gauging whether their investments are meeting the desired risk-adjusted returns. Overall, the Efficient Frontier empowers investors with valuable insights into portfolio management, facilitating informed decision-making and the pursuit of long-term financial objectives.
How to set it up
Caveat: this stock analyser has only been configured for 3 publicly listed companies. There is a possibility for it to be reconfigured for more or less.
https://docs.google.com/spreadsheets/d/1Brsjxb0W-KzaWX7jEirftekzkie5zcFCpKnpMwx47O0/edit#gid=0
Choice of Stocks
Apple – AAPL
IBM – IBM
Google – GOOG
I’ll set up the spreadsheet with these tickers, add the Date, and then use the GOOGLEFINANCE function to draw the finance data:

Pulling the data
The GOOGLEFINANCE function requires a couple of variables to work. The first variable is a company’s ticker, and we have placed those in B2:D2. The second variable is asking for particular attributes about the company, and since we’re interested in the close data, we’ll enter “close”. The third and fourth variables are [start_date] and [end_date|num_days]. If we want this to be the most up-to-date data, we can use the TODAY() function as the end date and we can set a changing date for the start date. To do this, we can allocate a cell to be the number of days we want to look back in history and minus TODAY() from that:
=GOOGLEFINANCE(B2,“close”,TODAY()-$A$2,TODAY())

Depending on the number that you put in A2 and the day of the week you start, there may only be 1 entry. For instance, today is a Monday, so this number, 45,331.67, should convert to 09/02/2024 when we format it. You will most probably need to do this too:

After formatting:

I’m going to adjust this GOOGLEFINANCE formula a bit. I want to only draw the close data for each stock. Since I’ll be doing this for the close data, I’ll also do it for the date. So, here are the two formulas that I will enter into A3 then B3:D3:
A3:
=INDEX(GOOGLEFINANCE(B2,“close”,TODAY()-$A$2,TODAY()),,1)
B3:D3:
=INDEX(GOOGLEFINANCE(B2,“close”,TODAY()-$A$2,TODAY()),,2)

This now means that the date and tickers are independent of one another. For this dataset, I’m going to pull request for 100 days, so I’ll change that 3 in cell A2 to 100:

I’ll so format these cells a bit too and colour automated cells a light grey:

Calculating returns
Let’s calculate some returns:

=(B5/B4)-1
I can now format this cell as a percentage, drag the formula across and down too:

Gathering some summary statistics
Before implementing an X matrix (next), I will gather some summary statistics, so that I can successfully implement that matrix). So, I will calculate the following bits of information (these cell references are specific to AAPL):
- Expected Returns – E(r)
=AVERAGE(F3:F42)
- Number of observations (per stock) – n
=COUNTA(F3:F)
- Standard deviation – σ
=STDEV.S(F3:F42)
- Variance – σ2
=O5^2
- Modified Sharpe – E(r)/σ
=O3/O5


Implementing an X Matrix
Now that we have these summary statistics, I will create the X matrix for each of the stocks:

=F3–O$3

=H7–Q$3
For ease of calculations later, I’m going to select the X matrix and create a named range, X:

Clicking on the selected range will allow you to insert a name:

Typing the name, X, then clicking on the named range menu item, X, will confirm the naming:

Whilst I’m here, i’m also going to create a named range for:
- n, and

- Standard deviation:

Covariance and Correlation matrices
Covariance matrix
Next, we’re going to implement the covariance table:
VARCOVAR: Σ = XTX/(n-1)
This is why I created the named range earlier; it makes it a lot easier. First, I’ll insert the names of the stocks, by using cell referencing:

Next, I’ll transpose those stocks names:

Then I’ll enter the formula for the covariance matrix:

=ARRAYFORMULA(MMULT(TRANSPOSE(X),X)/(n–1))
To check that this is correct, I can compare the variance outputs from the summary statistics and the newly created matrix:

Correlation Matrix
Next, we’re going to implement the correlation matrix:
Correlation: sqrt((varcovar/(σTσ)))
Just like the Covariance matrix, I’ll start by inserting the stock names through cell references:

Next, I’ll transpose those stocks names:

Then I’ll enter the formula for the correlation matrix:

=ARRAYFORMULA(SQRT(varcovar/MMULT(TRANSPOSE(stddev),stddev)))
Now we can check the correlation matrix:

The diagonal shows all 1s, suggesting that this is correct as AAPL, IBM, and GOOG should be correlated exactly 1 to itself. This current information shows that IBM does not correlate very well with GOOG. These two could possibly work well in a portfolio as they’re not highly correlated.
Now, what can we do with this information? Well, that depends on you. Have you decided how you want to invest in the market? The following is a list of some strategies that people make investment decisions from.
Investment Strategies
Growth investing: focuses on selecting companies which are expected to grow at an above-average rate in the long term, even if the share price appears high. Types of growth investments can include smaller companies, emerging markets, recovery shares, internet and technology stock.
Value investing: relies on the market overreacting to good and bad news, resulting in extremes of stock price movements which don’t necessarily match a company’s long-term outlook. Investors buy stock when the price is low and sell when it increases.
Quality investing: focuses on companies with outstanding quality characteristics such as credibility of the management or stability of the balance sheet. A quality portfolio can contain both growth and value attributes.
Index investing: also known as passive investing; focusing on creating a portfolio of assets designed to match the returns of a market index. The assets held by the portfolio will be entirely defined by the components of the selected index.
Buy and hold investing: focuses on purchasing securities and holding these for a long period of time (usually many years) to achieve returns.
Strategy to choose
We can try a couple of different use cases out to see how this efficient frontier chart will look:
Equally weighted portfolio
Again, we’ll start by inserting the stock names through cell references:

Then enter the information we’ll be looking for:

We’ll start the calculation by placing in the ratio of each stock on the portfolio:

=1/3
Next is the Expected return for each stock in the portfolio, i.e. what is the percentage of AAPL in the portfolio and multiply that by their expected return, etc (for IBM and GOOG):

=SUMPRODUCT(O22:Q22,$O$3:$Q$3)
The standard deviation of the portfolio uses the following formula: SQRT(wΣwT). So, I will enter this into cell O24:

=SQRT(MMULT(MMULT(O22:Q22,varcovar),TRANSPOSE(O22:Q22)))
Last is the Sharpe ratio:

=O23/O24
And we’ll format it so we can understand what has been manually entered and what is automatically calculated. This is the outcome of this portfolio having equally weighted stocks:

For the next three parts, I’m going to set them up in Google Sheets, then we’ll have to export the spreadsheet and open it in Excel due to the analysis that needs to happen. If you’re still interested in pursuing it solely through Google Sheets, I suggest you look at either Open Solver and/or Goal Seek.
- Minimum variance weights

- Maximise the Modified Sharpe Ratio

- Random allocation

Minimum variance weights

We can now use Solver to provide the information that we need for this investment strategy:

This output shows us that we should invest everything into Stock 1, based on the minimum variance weights:


Maximise the Modified Sharpe Ratio


Random allocation
To set this up, we need to enter the RANDARRAY(1,3) into O39. This will create a 1×3 array, with a randomly generated number between 0 and1:

Next, sum all three of those randomised array values:

To calculate the weights of each of these randomly assigned values, we can take each individual cell (O39:Q39) and divide it by the sum value in R39. To check that this is correct, I have added another sum function in R40:

=O39/$R$39
Just like the other strategies, we can use SUMPRODUCT to calculate the return of the portfolio:

I will add the modified Sharpe ratio to the Trials section of the workbook:

I have added the SEQUENCE function underneath Trials and set the rows to 10,000:

To create the data points, we are going to use the Data Table function. First, select the table:

Under the Data tab in the ribbon, select What-if Analysis and click Data Table:

Select an empty cell in Column input cell and click OK:

A table of values will output into these columns:

Now I can calculate the modified Sharpe ratio for all of these trials:

Finally, I can copy this back to Google Sheets:

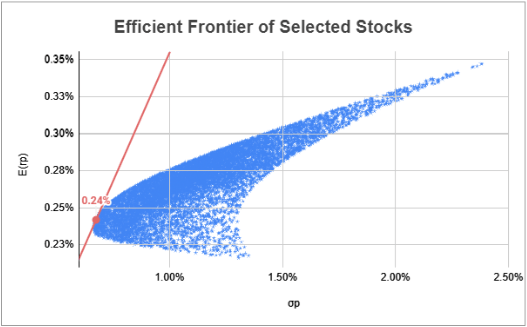
Mapping these Stocks
The two dimensions that we are interested in observing amongst these stocks are the expected return and volatility (standard deviation). So, let’s select those two columns and then Insert a chart:

In Setup, select Scatter chart:

Since there are 10,000 data points, the size of those dots will be too big. Plus, we’ll need to format this graph a bit so let’s get into it. Whilst selecting the graph, click Customize, Series, then change Point size to 2px:

That’s looking a little better:

Let’s now format the y-axis. You can either click the numbers along the y-axis or, on the right customize panel, stroll down to Vertical axis and expand the option:

For this dataset, let’s set the minimum to 0.002, but this may be slightly different for you:


I’ll change this axis Number format from From source data to Percent:

I’ll do the same for the x-axis:

I’ll update the graph and axes titles and move it to a sheet named Chart:

Optimal Portfolio Bundle
This optimality is based on the strategy that you have chosen, e.g., your optimal bundle is based on your preferences and the financial constraints you would set on the portfolio. This means that we’re going to need a few things to account for when choosing this bundle.
Choice Between Strategies
We have outlined these four strategies: equally weighted portfolio, minimum variance weights, maximise the modified Sharpe ratio, and random allocation. Depending on the chosen strategy, we will have a different mix of stocks in the portfolio. So, I’ll create a dropdown menu for a user to choose and compare these outcomes. I’ll also use the CHOOSE Sheets function to assist with this.
The first three are already explicitly stated in the spreadsheet, so I can place a simple cell reference for them. For the random allocation though, we need to search through 10,000 data points to find the optimal bundle. Let’s use our old friend INDEX-MATCH to do this.
I’m thinking ahead to using 3 of the 4 columns of the trials table (below), that’s why I’ll be creating the INDEX function the way that I am:
I want to index the entirety of the table. Next I want to find the best return for the random allocation, which will be the Sharpe ratio (column W). The best return in this case is the highest value (closest to 1). This means I will need to use the MAX() function to find the largest number in this column. The second argument of the INDEX function is row. I want to MATCH the largest value, MATCH, in column W, using the range (second argument of MATCH) W3:W, and find the exact value (0). The remaining 1 will return column 1 of the INDEX T3:W, i.e., the Trial/Index number.
=INDEX(T3:W10000,MATCH(MAX(W3:W),W3:W,0),1)
This is telling me that the largest modified Sharpe ratio is located at index 1739:

Now, let’s use this information to also obtain the standard deviation and expected return of the portfolio. I could use a VLOOKUP on the returned INDEX, or I can use the same INDEX-MATCH formula and adjust the column output. Let’s do that for: the standard deviation:
=INDEX(T3:W10000,MATCH(MAX(W3:W),W3:W,0),2)
And the expected return:
=INDEX(T3:W10000,MATCH(MAX(W3:W),W3:W,0),3)

Let’s now create that dropdown menu. I’ll use those strategies as items. I’m going to select three cells and merge them, then go to Insert and select Dropdown:

Now to enter those values into the data validation rules:

Here’s what it looks like:

Now comes the CHOOSE function. This function returns an element from a list of choices based on index. So, since I’ve listed these items in a list, they will appear based on their index number in the list. Let’s start with an example; here is the formula:
=CHOOSE(index, choice 1, choice 2, etc)
Let’s say I have three choices; Number 1, Number 2, and Number 3.
=CHOOSE(,“Number 1”, “Number 2”, “Number 3”)
From this list, choice 1 is “Number 1”, choice 2 is “Number 2”, etc. Let’s add a 1 to the index argument and see what the cell outputs:

Now 2:

Instead of writing in the number though, we can insert a cell reference:


Let’s try 1 then 3:


I think you got the picture. So, let’s create this lookup menu for us to reference:

I’m going to use a combination of CHOICE, VLOOKUP, and the previous INDEX-MATCH formulas to get the results I’m looking for. This is for INDEX:
=CHOOSE(VLOOKUP(Y8,Y18:Z21,2,0),,,,INDEX(T3:W10002,MATCH(MAX(W3:W),W3:W,0),1))
This is for standard deviation:
=CHOOSE(VLOOKUP(Y8,Y18:Z21,2,0),
O24,
O30,
O36,
INDEX(T3:W10002,MATCH(MAX(W3:W),W3:W,0),2))
And this is for the expected return:
=CHOOSE(VLOOKUP(Y8,Y18:Z21,2,0),
O23,
O29,
O35,
INDEX(T3:W10002,MATCH(MAX(W3:W),W3:W,0),3))
Are you able to break this down?
- INDEX:
We are using VLOOKUP(Y8,Y18:Z21,2,0) to select our choice (index) number; ‘Equally weighted portfolio’ = 1, …, ‘Random allocation’ = 4. If 1 is selected, we do not need to search the INDEX, hence the response is blank/null. Same for 2 and 3. However, if ‘Random allocation’ (4) is selected, we run the INDEX-MATCH function.
- Standard Deviation:
Like in INDEX (above), we are using the VLOOKUP function to trigger our CHOOSE function. If the INDEX = 1, we are calling cell O24, which is the equally weighted portfolio standard deviation. 2 is calling cell O30, the minimum variance weighted portfolio, etc.
- Expected return:
This is the same as Standard deviation, except we are calling the expected return cell for each portfolio based on the choice selected.


Capital Allocation Line
The Capital Allocation Line is a straight line that represents the risk-return profile of a portfolio that includes a risk-free asset and a risky asset, i.e., stocks. This line helps investors determine the optimal combination of risky assets and a risk-free asset in their portfolio. Essentially, this is an investor’s trade-off line between risk and return. Let’s build the formula in Google Sheets to help visualise what’s going on.
I have set up the Capital Allocation Line information in Y1:AA5. The 0% here suggests that I would invest all of my money into the risk-free rate. 100% suggests that I would invest all of my money into the optimal bundle, where the Capital Allocation Line is tangent to the portfolio returns:

This function is diverse across all only necessary if the random allocation strategy is selected. It is calculated by the relative weight of the investment by the and the return of the optimal bundle, located in Y9:AA10. The Return function reads below:
=(Y3*$AA$10)+(((1–Y3)*(2/252)))
Since we’re dealing with daily trading information, we need to use the ratio to calculate the risk-free rate: 2/252 ~= 0.8%. Now, the standard deviation of the optimal portfolio:
=Y3*$Z$10
This output shows that, when we invest 100% into the risk-free rate (0% of our portfolio), we expect to see a .8% return with no risk, 0%. If we invest all of our investment money into this equally weighted portfolio, we can expect to see a .22% return at 1.05% risk. If we were to borrow 100% of our money (with the aim of earning ours and the borrowed back), we can expect to lose .35% at a 2.1% risk level.

We can see the difference in the Minimum variance weights strategy:

Now we can use the information from Z3:AA5 to plot the Capital Allocation Line. I create a new chart, remove all of the text/formatting on the axes and lay it on top of the the previously made chart:

Investment Split Amount
Now that we have all of this information…what do we do? This is where we can understand our monetary allocation of our total investment amount. For this example, I have arbitrarily chosen to invest $2,546 into this portfolio. Based on a chosen strategy, it has indicated that I should be allocating the following divisions between the companies:

This allocation is being calculated using the following formula:
=CHOOSE(
VLOOKUP($Y$8,$Y$18:$Z$21,2,0),
(HLOOKUP(Y13,$O$21:$Q$22,2,0)*$Z$12),
(HLOOKUP(Y13,$O$27:$Q$28,2,0)*$Z$12),
(HLOOKUP(Y13,$O$33:$Q$34,2,0)*$Z$12),
(HLOOKUP(Y13,$O$40:$Q$42,3,0)*$Z$12))

Similar to choosing between the strategies, we are using the CHOOSE and VLOOKUP functions to determine which stock information to draw from. To explain this formula, I will choose the equally weighted portfolio to explain the logic. This logic applies to the other investment strategies.
If the equally weighted strategy is chosen, the formula calculates the amount to invest by using HLOOKUP:
(HLOOKUP(Y13,$O$21:$Q$22,2,0)*$Z$12)
In HLOOKUP, it will first search for the ticker in the equally weighted portfolio section, and provide the value in the second row. From here, it will multiply that value, in this case 33.33% by the total amount to invest, $2,546. The outcome will be $849:

Conclusion
Navigating the world of stock investments requires careful consideration and strategic planning. Understanding key factors such as risk tolerance, financial goals, and market conditions is essential for making informed decisions. By diversifying portfolios, evaluating company fundamentals, and monitoring market trends, investors can mitigate risks and optimise returns.
Moreover, leveraging tools like the Efficient Frontier offers valuable insights into portfolio optimisation and risk management. By identifying optimal portfolios that balance risk and return, investors can construct well-rounded investment strategies tailored to their objectives. Whether it’s adopting growth, value, or quality investing approaches, or implementing passive or active investment strategies, the Efficient Frontier serves as a guiding principle for portfolio construction.
Furthermore, harnessing technology such as spreadsheet analysis allows investors to visualise portfolio performance and explore various investment strategies. By calculating returns, assessing risk, and optimising portfolio allocations, investors can align their investment decisions with their financial goals and risk preferences.
Ultimately, by incorporating these strategies and leveraging available resources, investors can navigate the complexities of the stock market with confidence and work towards achieving their long-term financial objectives.

One response to “47 – Efficient Frontier”
[…] The same goes for this post about the Efficient Frontier: […]