
Last Week’s Homework
Here is the (safe) download link if you’re interested in checking:

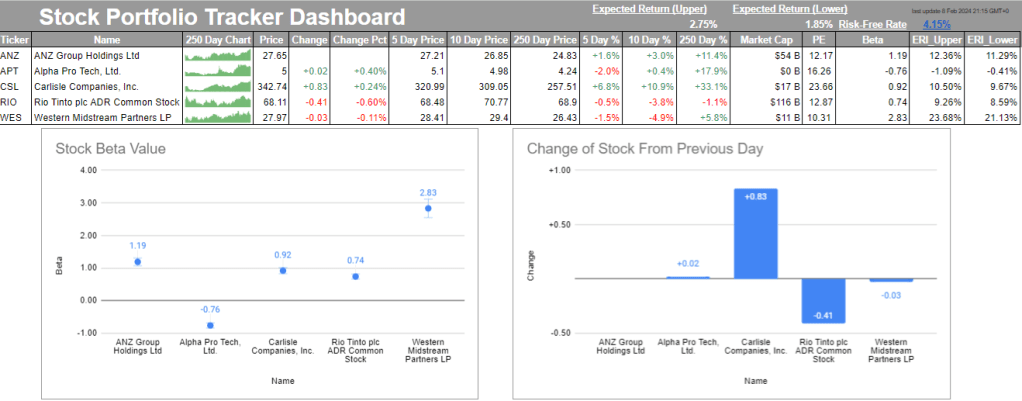
Stock Portfolio
Do you have some stocks hidden away somewhere? How are they going? What did they return yesterday? What about 5 days ago? 10 days? 250 days? Do you currently know what the firm’s beta is? At the end of this blog, you’ll be able to answer these questions about your publicly traded stocks just by opening up your Google Spreadsheet. Here’s the spreadsheet that I worked on throughout this blog.
https://docs.google.com/spreadsheets/d/1CXN8BKoR0VGuxFR6le1mEDn-BKY8GXXRKNVU9215DdU/edit#gid=0
Obvious caveat: this is not financial advice. Get your own financial advisor. This is just a way to display a series of stock information.
Throughout this blog, I will be using a series of functions, but primarily the GoogleFinance function (included in Google Sheets). However, there will be some other functions that are necessary but not included within the function. For now, here are some available attributes of the GoogleFinance function that we will be using. The following is a disclaimer that Google posts at the bottom of the spreadsheet:
Quotes are not sourced from all markets and may be delayed by up to 20 minutes. Information is provided ‘as is’ and solely for informational purposes, not for trading purposes or advice.
This is how I’m going to start setting up my Dashboard

First, I’m going to fill in the tickers of the stocks that I want to follow (or that I have invested in):

GoogleFinance Functions
- Name: this returns the name of the company/business based on the public ticker,
I can use this name attribute to automatically pull the name of the ticker that I have inserted into Column A:
=GOOGLEFINANCE($A4,$B$3)


- Price: real-time (current) ticker’s price quote, delayed by up to 20 minutes,
Next, I can use the ‘price’ attribute to pull the price for each of the ticker:
=GOOGLEFINANCE($A4,$D$3)

- Change: the price change since the previous trading day’s close,
=GOOGLEFINANCE($A4,$E$3)

We are also going to format it with: Format > Number > Custom Number Format:
[color50]+#,##0.00;[red]-#,##0.00;


- Change Pct: the percentage change in price since the previous trading day’s close,
=GOOGLEFINANCE($A4,“changepct”)/100

We are also going to format it with: Format > Number > Custom Number Format:
[color50]+#,##0.00%;[red]-#,##0.00%;


- 5/10/250 Day Price: ‘x’ day(s) historical price,
Using the [start_date] optional attribute, we can start to look into the past and observe history day prices. I will complete this by using trading day information (Google Sheet’s WORKDAY function) and the current day (Google Sheet’s TODAY function) when the dashboard is opened. Since I will want to use this for 5, 10, and 250 days, I will set the past number of days as negative (number in the column title). If I were to display this GoogleFinance function with the INDEX function, it would return a 2×2 array, so I will need to perform a lookup on the 2nd row and 2nd column for this value:
=INDEX(GOOGLEFINANCE($A4,“price”,WORKDAY(TODAY(),-G$3)),2,2)


- 5/10/250 Day %:
Using the [start_date] optional attribute, we can start to look into the past and observe history day prices as a percentage.
=$D4/(INDEX(GOOGLEFINANCE($A4“price”,WORKDAY(TODAY(),-J$3)),2,2))-1

Let’s format all of these too:

- Market Cap: the market capitalisation of the stock,
Market capitalisation is the aggregate market value of a company represented in a dollar amount. Since it represents the “market” value of a company, it is computed based on the current market price of its shares and the total number of outstanding shares.
=GOOGLEFINANCE($A4,“marketcap”)

That’s a lot to count. Let’s format this one too:


- Price-Earnings Ratio (PE): the price/earnings ratio,
This ratio is used when valuing a company that measures its current share price relative to its earnings per share (EPS).
=GOOGLEFINANCE($A4,$N$3)

- Beta: the beta value.
A company’s Beta value is a measure of a stock’s volatility in relation to the overall market. By definition, the market, such as the S&P 500 Index, has a beta of 1.0, and individual stocks are ranked according to how much they deviate from the market. A stock that swings more than the market over time has a beta above 1.0. If a stock moves less than the market, the stock’s beta is less than 1.0.
=GOOGLEFINANCE($A5,$O$3)

This one was a bit interesting. I had to retrieve the ANZ beta information from another source, specifically MarketWatch (https://www.marketwatch.com/investing/stock/anz?countrycode=au). I used the following IMPORTXML code to retrieve it:
=IMPORTXML(“https://www.marketwatch.com/investing/stock/anz?countrycode=au”,“/html/body/div[3]/div[6]/div[1]/div[1]/div/ul/li[7]/span[1]”)
Other Resource Functions
- Risk-Free Rate: https://www.worldgovernmentbonds.com/bond-historical-data/australia/10-years/#:~:text=The%20Australia%2010%20Years%20Government,%3A15%20GMT%2B0
We use government bonds as the risk-free rate given that banks will be bailed out during economic and financial hardship. …amongst other institutions that we’ve seen since the 2008 GFC. Since I reside in Australia, I will use the Australian 10-year government bond metric.
To best represent Generally Accepted Accounting Principles (GAAP) within economic truth, Capital Asset Pricing Model (CAPM), I will be using the above market risk premium as it provides the best yardstick at this current point in time (economically and from a model perspective).
The next two calculations rely on the following three variables to be calculated: the risk-free rate, the company’s beta value, and market risk premium. You are able to calculate the market risk premium by using both the risk-free rate and the expected equity market return for that stock. Since we aren’t using that information and we have found the risk-free rate and market risk premium, this means we can now join them with each company’s beta to calculate the:
- Upper value of the Expected Return on Investment (ERI_Upper):
Risk-free Rate + Company’s Beta * Market Risk Premiumupper.
=$P$2+O4*$S$1
4.08% + 1.20 * 6.90%

- Lower value of the Expected Return on Investment (ERI_Lower):
Risk-free Rate + Company’s Beta * Market Risk Premiumlower.
=$P$2+O4*$S$2
4.08% + 1.20 * 6.00%

250-Day Chart
Remember our good, old friend SPARKLINE? Well, we can actually get a bit more pop out of this function by integrating some colour. Looking back through the logic for the 5/10/250 day price, we can use the same logic here when constructing the SPARKLINE data for in-cell chart.
=SPARKLINE(INDEX(GOOGLEFINANCE($A4,“price”,WORKDAY(TODAY(),-$C$3),TODAY()),,2),{“charttype”,”column”;”color”,”green”})
Charts
To finish off, we can include broad charts to assist us when analysing this information at a glance.
Stock Beta Value
Let’s set up a chart that tracks stock’s beta values and track them each day.

We’re going to create a Scatter plot using the Company name (column B) and their beta value (column O).

I’ll name the chart ‘Stock Beta Value’:

Then under Series I will select the ‘error bars’ and ‘data labels’ options so that I can see what the values are and where the variance lays:

Change of Stock from Previous Day
Since I want to know how my stocks have performed since yesterday, I will want to see this at a glance.

We’re going to create a Bar (column) graph using the Company name (column B) and their change in stock price (column E).

I’ll name the chart ‘Change of Stock From Previous Day’:

Then under Series I will select the ‘data labels’ option so that I can see what the values are:

Summary

Have you had any experience in stocks? Have you shopped around for different mutual funds? What was your take on this blog – opinions regarding the integration of GAAP to CAPM? Let me know – I would love to hear your thoughts and strategies for navigating the random walk.
Can you…?
Using some of the techniques shown in this post – IMPORTHTML, IMPORTXML, INDEX, ARRAYFORMULA, SUBSTITUTE, STDEV, etc – are you able to determine the Sharpe Ratio for each of these (or your own stocks)?
Sharpe Ratio formula: (Upper Expected Return of a stock – Risk-free rate) / standard deviation of your stock’s (recorded) history.
Bonus Points: can you make this process automated in another sheet, linked to the Dashboard?

3 responses to “34 – Building a Stock Portfolio Tracker in Google Sheets”
[…] sites make the transition from static to dynamic at random times…even the day before you release a blog post about pulling this exact type of […]
[…] a publicly traded firm’s beta value. However, this was all to check the day before my post about Building a Stock Portfolio Tracker in Google Sheets was released where a bunch of my calculations were erroring out due to changes made to the […]
[…] a previous post, I outlined how someone might be able to track their stock portfolio. Speaking of, have you copied […]