Overview
A Data Analysis Project that explores the available COVID-19 data from Our World in Data in SQL, Tableau, and Python. The purpose of this project is to showcase the world of COVID-19 through the lens of a data analyst and how this information can be presented to people in an easy-to-understand manner.
Analysis includes:
- SQL Server creation, data exploration (with some example SQL queries), and preperation for visualisation,
- Calculating the likelihood of death
- Total count by location
- Comparing infection rates across nations
- Carry count of all vaccinated peoples
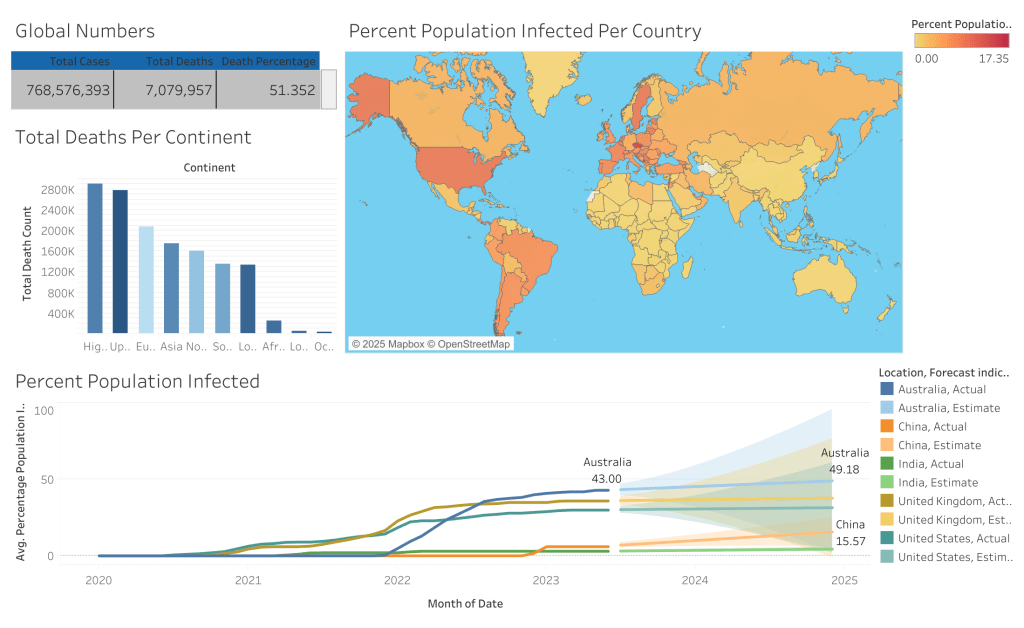
- Tableau visualisation,
- Table for certain records,
- Bar chart of deaths by Continent
- Global map with population percentage infected
- Running total of the average population (percentage) infected by certain locations and forecasting
- SQL ETL process, and
- Standardising dates
- Dealing with NULLs
- Separating concatenated address information
- Replacing text of numerous records
- Removing duplicates
- Deleting unused columns
- Python, including the Pandas library for data cleaning, and visualisation.
Entire Process: Gathering, Preparing, and Presenting Data
Section 1 – Dataset
The COVID-19 deaths dataset was accessed on 10 May, 2021, and it was split into two files. These two files contain data pertaining to COVID-19 deaths and COVID-19 vaccinations.
Section 2 – Data Cleaning
Microsoft SQL Server
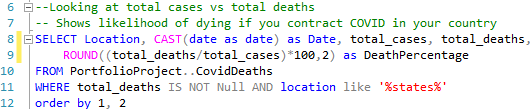
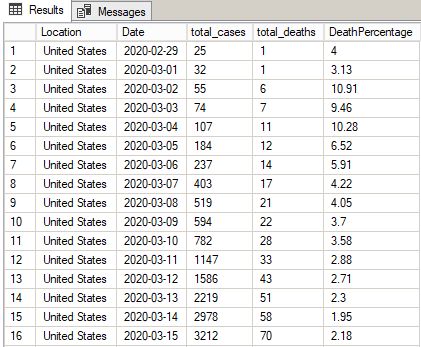
Beginning with some standard observations, the first query observes certain statistics of the United States, ordered by location and Date (oldest to newest). Given the data, it is necessary to CAST the date to remove the timestamp. In order to clean the DeathPercentage formula output, a WHERE clause was added to remove all NULLs. It is noticeable at the beginning of the data that it shows a higher death percentage. Towards the end of the available data, the rate tends towards 1.8%.
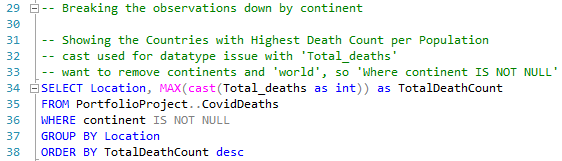
Organising the data by the TotalDeathCount, the output shows the top 22 countries of total number of people reported to have died from COVID-19.
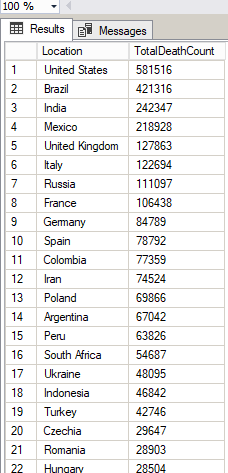
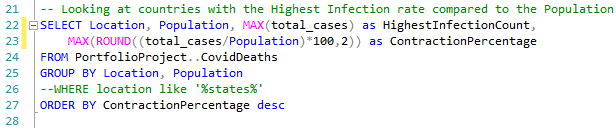
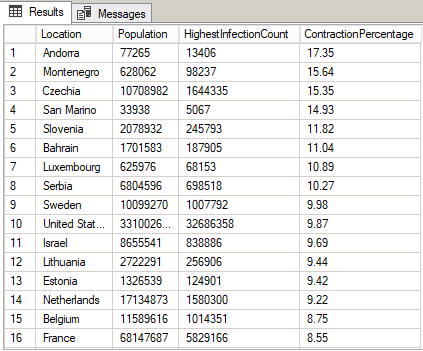
The below output shows the global number of the highest number of infections and the contraction percentage in each location.
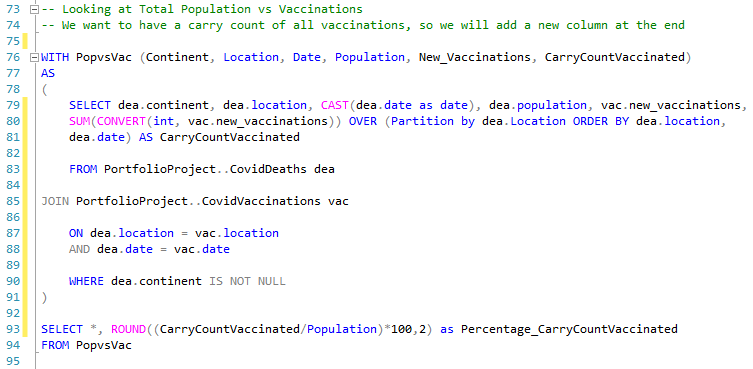
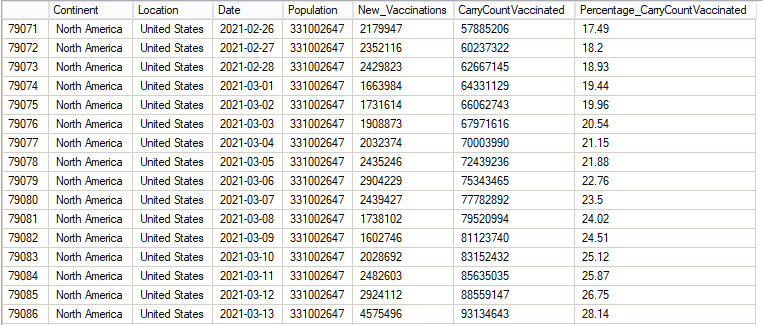
In order to look at population (deaths) and vaccinations numbers, it is necessary to join the two tables (datasets). This will be achieved by joining both on location and date. Our question to ask is: how many people in the world have been vaccinated? If solely looking at the new_vaccinations entries, these show how many vaccinations have been administered each day. Our analysis calls for a cumulative total so in order to create a running total (carry count) of all vaccinations, we need to create a common table expression, WITH function. It will need to be partitioned by each location, so that it only counts each country’s vaccination numbers.