
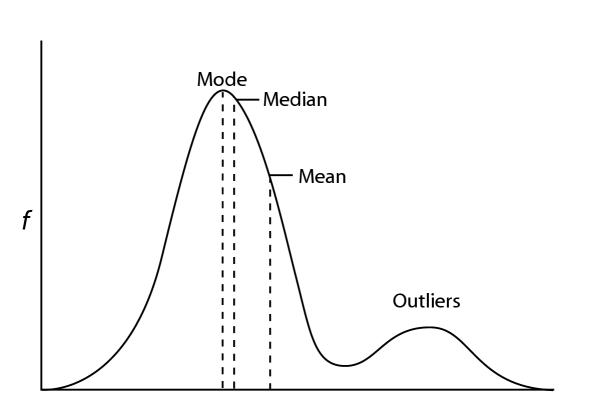
The first time I came across a ‘Z-score’ I was in an ‘Introduction to (economic) Statistics’ class. I had remembered terms like standard deviation, mean, mode, and average from High School, but never really understood how to use them in day-to-day work. Let alone Z-scores. As I journey through life, I find more connections to things that I’ve (drilled) learned in the past and knowledge I’m picking up on the go; maybe that’s what the whole university training thing was about.
I have gathered some data (Product, Date, Sales amount) and will be using this to retrieve the sales’ Z-score and showing how to use this information. I am going to report on the previous month’s sales and analyse the outlier within the data.
What is a Z-score?
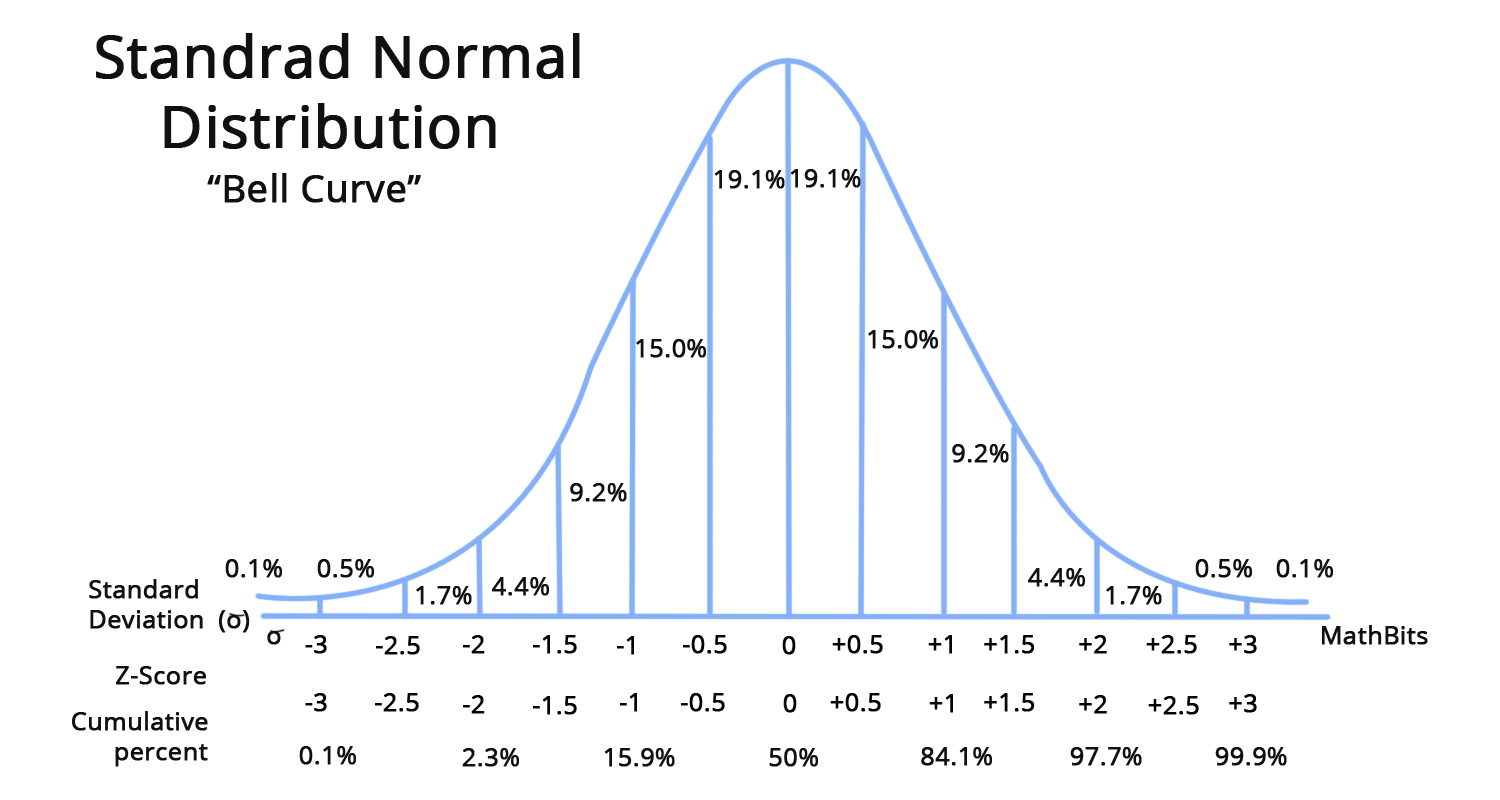
Firstly, a Z-score is a statistical measurement that describes a value’s relationship to the mean of a group of values. Z-score is measured in terms of standard deviations from the mean. If a Z-score is 0, it indicates that the data point’s score is identical to the mean score.
Source: https://www.aakash.ac.in/important-concepts/maths/z-score-table
So, whenever you hear someone talking about the ‘standard distribution’ table, a z-score on that table shows you where it sits on that distribution. More specifically, the probability that you would find that score/value on the distribution, given the random sample they have taken from the population.
This is what a Z-score looks like mathematically:

where:
Z = standard score,
x = observed value
µ = mean of the sample
σ = standard deviation of the sample
Calculate Average and Standard Deviation
To calculate the Z-scores for each data point within that Google Sheets link above, we need to calculate the Average and Standard Deviation of the Sales within the dataset.
Average

So, the average of sales is $3,181.
Standard Deviation
I am going to use the ST.DEVP function as this is the entire data (population) and not a sample of the monthly data.


The standard deviation of this sales data is $2,875. This number suggests to me that the data is quite varied, meaning we may have some days that had either much lower than average sales or much higher than average sales. That’s where we’re heading with our outlier analysis.
Calculate Z-score
Since we have that Z-score definition above, we are going to use that to calculate the Z-score for each data point in this dataset. I will create a new column, next to Sales, and create the formula:

I have included absolute referencing as I am going to copy the formula down column E, and don’t want the average or standard deviation cells to move.

What’s an Outlier?
Since we’re going to be looking for outliers, first we need to know what they are. These are visual representations of outliers in various contexts:

Source: https://statisticsbyjim.com/basics/outliers/

Source: https://cxl.com/blog/outliers/

Source: https://cxl.com/blog/outliers/
Can you guess what an outlier is? Try and give your own definition. Seriously, take a minute and write something down. (Can you see that it’s hard for me to shake that teacher brain?) By (statistical) definition, an outlier is a data point that differs significantly from other observations. An outlier may be due to a variability in the measurement, an indication of novel data, or it may be the result of experimental error; the latter are sometimes excluded from the data set.
For our purposes, we’re going to say that an outlier is:
Any value with an absolute Z-score greater than 3.
So, this gives us a worded formula to start transforming into a Google Sheets formula.
Identify Outliers
To get an idea of what we’re on the hunt for, the screenshot below is highlighting a product whose sales on 01/01/2024 saw $9,091. This Z-score’s value is 2.06. This means that this total sales value is 2.06 standard deviations away from the mean (in a positive direction). Given our definition though, 2.06 < 3, meaning it is not an outlier.

There’s a few ways that we could identify and highlight outliers in this dataset, but I will choose to follow the IF formula approach. I will start by creating a new column next to E and title it Outlier:

Now we can transform that worded formula, from above, into an Excel/Sheets formula to find the outliers:

=IF(ABS(E6)>3,“Yes”,“No”)
Now I’ll copy the formula down and filter the table by ‘Yes’ in column F:

Here we can see that we have identified 4 outliers. Even by looking at the Sales for those products on those days, the numbers are quite large.
The Issue with Z-score
Have you considered what might not be the best representation of the outliers in this dataset? The issue with observing Z-scores in this manner is that we have a mix of products that we are co-analysing, i.e. Coco, nut bars, peanut butter cubes, Eclairs, spicy special slims. Although there is the argument that they are complement goods, this is a statement that we cannot measure with the data that we have at hand.
To create a better array of Z-scores, we should pool the data by its products and analyse the outliers using their own product level figures. For instance:

If we can identify what is an outlier within the ‘Drinking Coco’ values itself, this information will be more meaningful to report on. To do this, I will want to calculate a few attributes:
- Average of Product,
- Standard Deviation of Product,
- Z-score,
- Outliers (of this new data analysis subset).

Product Level: Average and Standard Deviation
To better understand why we are doing a product level analysis of this data, let’s have another look at that dog height comparison image again:
Source: https://cxl.com/blog/outliers/
This is almost equivalent to what we’re analysing with these different products. If we were interested in how all of our stock sold, we could use this global mean and average information. Let’s say though instead of 5 single, different dog breeds, we actually had numerous of the different kinds, i.e. 8 greyhounds, 13 French bulldogs, etc. What we would be finding is the average height of each of those dogs and investigating all outliers within each breed.
Average of Product
This is a similar calculation as the previous average formula, with a bit of an extension.

I am going to calculate the average of each product (column B) and I only want to include the sales figures (column D) that match the product in column B.

=AVERAGEIFS($D$6:$D$228,$B$6:$B$228,B6)
Standard Deviation of Product
Since there’s no built-in ‘standard deviation ifs’ function, we need to create our own function that will allow us to filter the result for each row, depending on the product (in column B).

=STDEV.P(FILTER($D$6:$D$228,$B$6:$B$228=B6))
So, we are going to first input the range of values we want the filter function to return; Sales. Next, we need the condition. For this, we are wanting to break down by product, so we will select the Product column and we are only interested in the information for each product. This means we want the condition to be the product in the row that we are currently on, hence $B$6:$B$228 is absolute referenced (for the range) and B6 is relative (for the auto-fill function).

When comparing the original standard deviation (M4) with the new product level standard deviations (column H), we can see how that original calculation would be throwing out the Z-scores. We can also see that the variance between standard devotions (on the product level) are different; i.e. ‘After Nines’ shows 1789.03 (more variance) on 01/01/2024 and ‘Almond Choco’ shows 1767.63 (less variance) on 01/01/2024. But, to make sure we understand this difference between the overall standard deviation and product level, let’s dig into the product level Z-scores.
Product Level: Z-score
Since we’re not on the product level for Z-scores, we do not need to concern ourselves with the previously calculated average and standard deviation. Instead, we need to use the calculations made in columns D, G and H:

We can now, also, implement the same IF function into column J:

Setting the filter on column J to yes, we can now observe more statistically accurate/significant outliers in the dataset:

We can even compare previous Z-scores with new ones, based on the information we have on the screen. It shows that ‘Drinking Coco’ is still an outlier, but the other two previously were not. This newly filtered dataset carries the implication that the previously thought outliers do not actually have a Z-score greater than 3 (on the product level).
Conditional Formatting
For ease of identification, we can add conditional formatting to this dataset to highlight the products with outlier sales figures:
- Select the table,

- Format > Conditional Formatting,

- Add another rule

- ‘Format Rules’ > ‘Custom formula is’,

- Enter formula: =IF(ABS($I6)>3,1,0)

We can now see the outliers in the dataset:

Why Do We Care About Outliers?
What you’re probably thinking now is: ‘great, but what do we do with them now? How do we update our analysis and report on it? Why do we care about outliers?’ Once the outlier values have been identified, this means that we can start a deeper level analysis into why these sales saw a boost or dive. There could be correlation between marketing or advertising at the time, another business driver, or pure randomness (YAY and FUN!).
Forecasting Monthly Sales using this Data
Using this monthly Sales data, we can actually start to predict future sales. We’ll be digging into that next week.

One response to “30 – How to Use Z-score With Sales Data”
[…] 30 – How to Use Z-score With Sales Data […]